Promote product launches, funding news, and innovations in 75+ countries by reaching top tech journalists and global publications.
Drive international attention to destinations, campaigns, and services by distributing news to relevant travel and lifestyle media worldwide.
Increase visibility of new products, campaigns, and brand stories by connecting with influential retail and consumer-focused media outlets.
Strengthen your crypto brand’s credibility through targeted PR in tech, finance, and blockchain media across global markets.
Expand your agency’s services with global PR distribution in 75+ countries, featuring guaranteed coverage, localized press releases, and white-label reporting for your clients.
What Is the BCG Matrix and How Is It Used? A Practical Guide for Companies
BCG Matrix Definiton
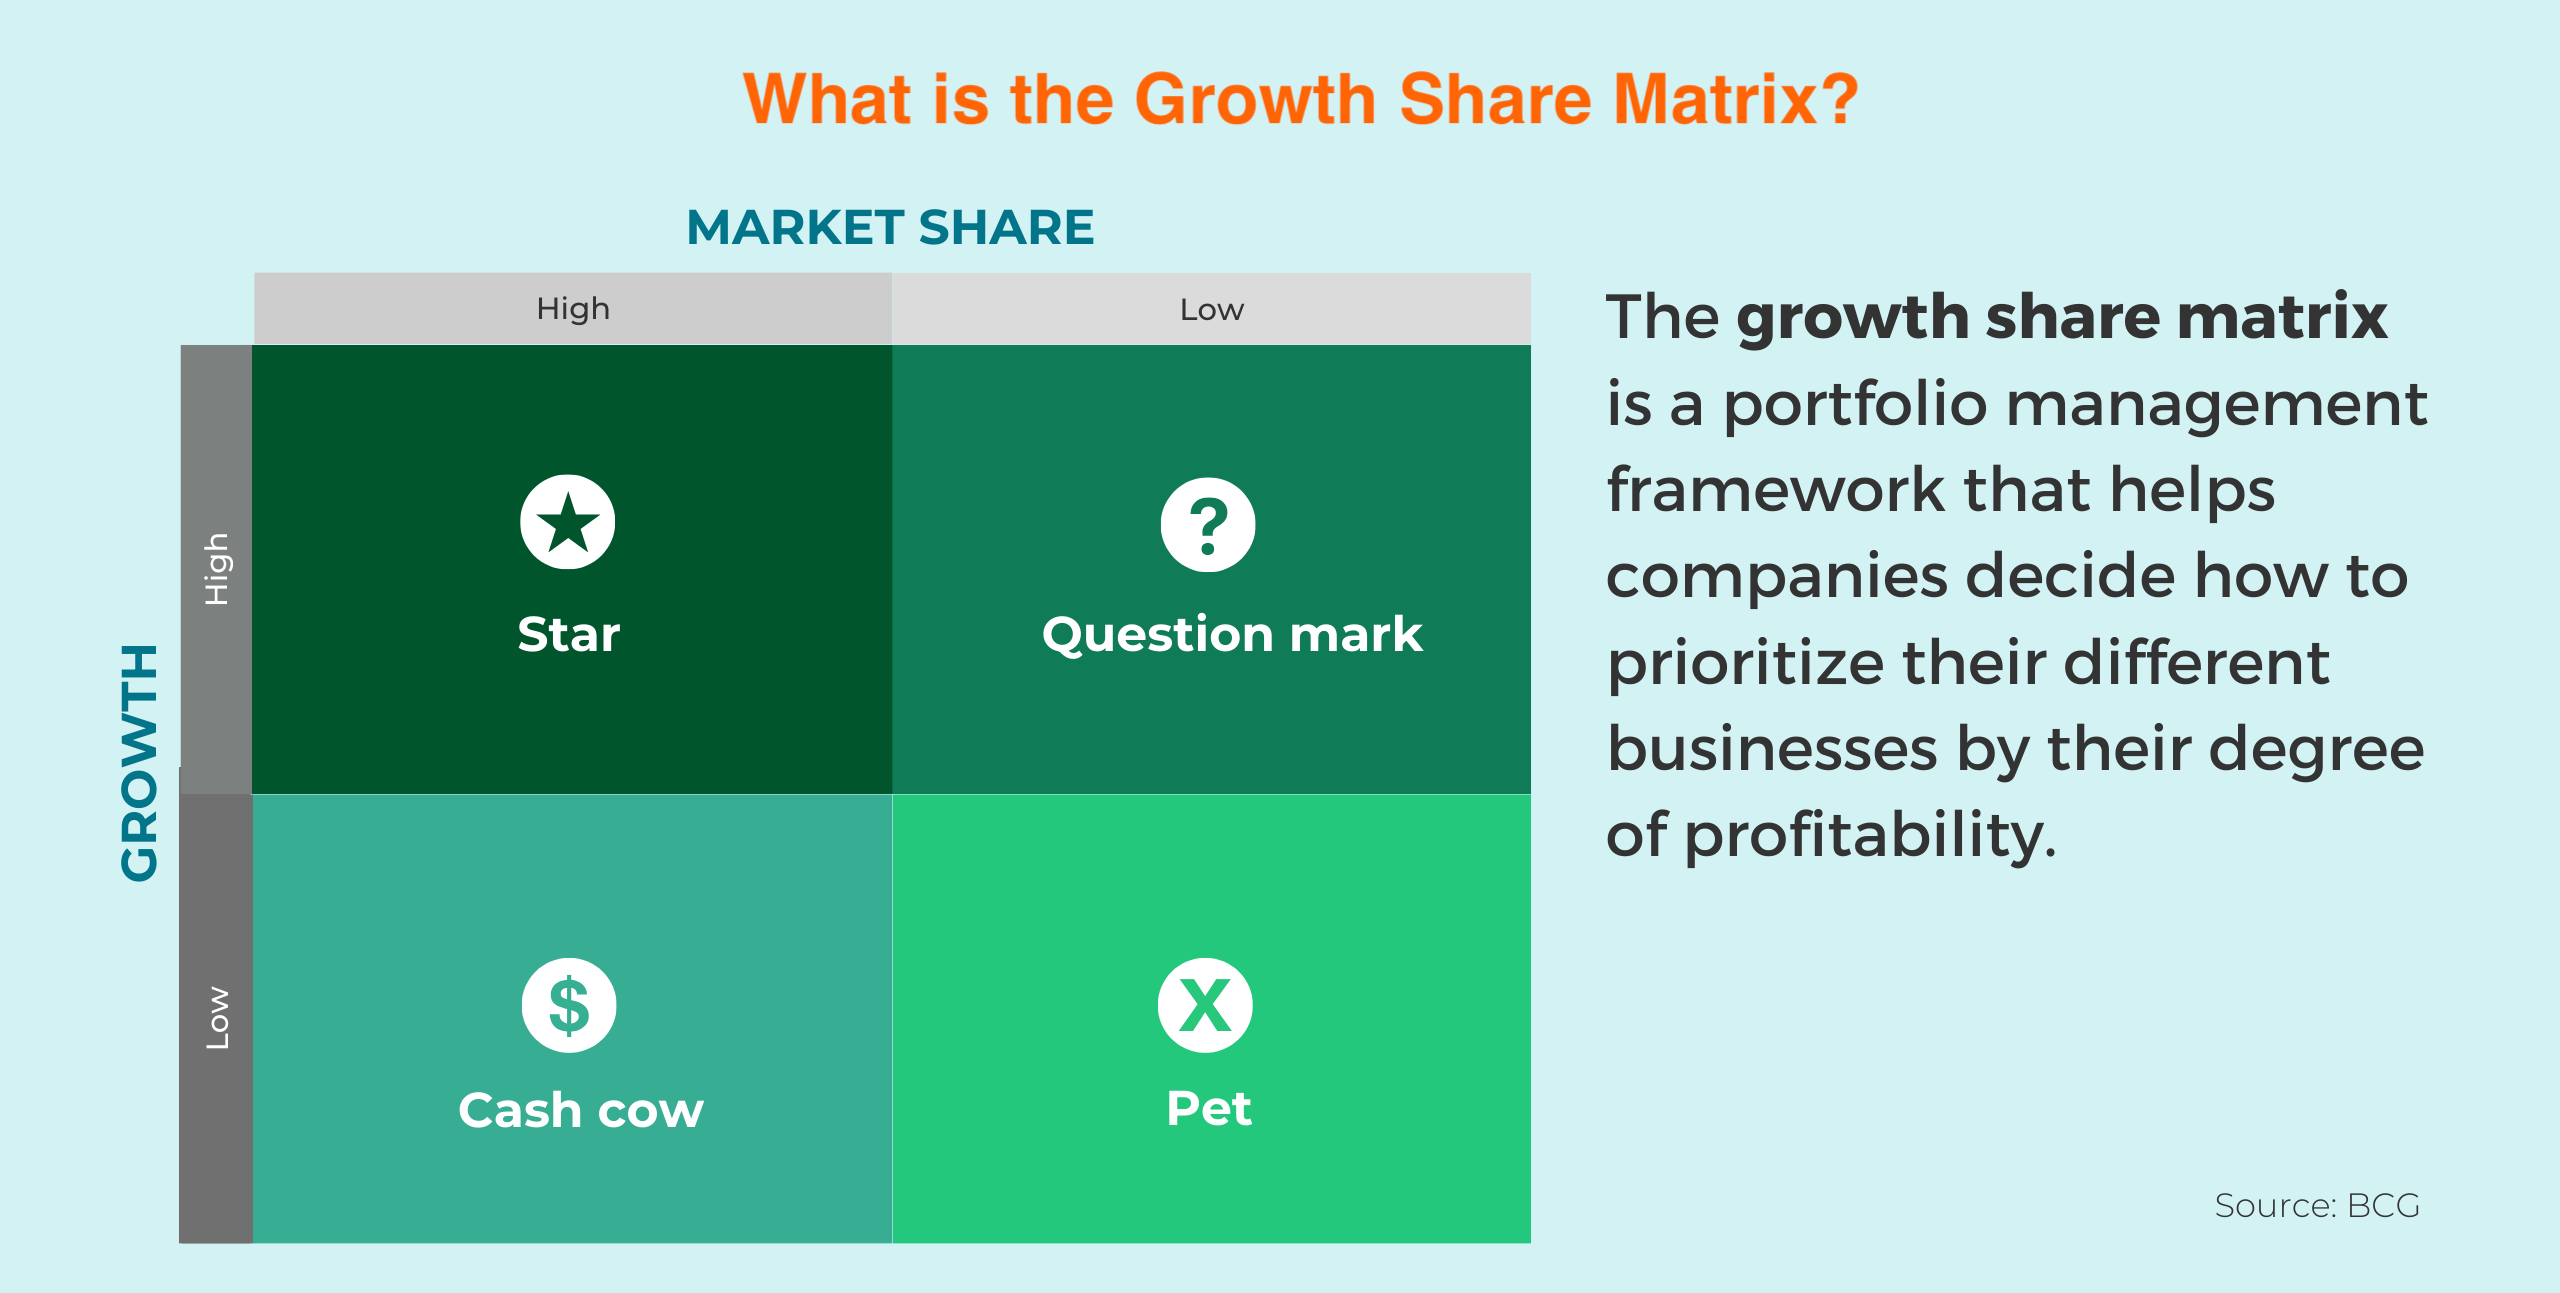
The BCG matrix, also known as the Boston matrix or the growth-share matrix, is a strategic planning tool that helps companies analyze their product portfolio and allocate resources effectively.
Developed by the Boston Consulting Group (BCG), the framework was initially drafted by Alan Zakon and later refined with colleagues at the firm. Bruce Henderson, BCG’s founder, popularized the concept in 1970 through his article “The Product Portfolio.” Since then, the BCG matrix has become one of the most widely used portfolio analysis tools in strategic management.
Today, companies use the BCG matrix not only to evaluate product performance but also to decide where to invest, where to maintain, and where to withdraw.
What Are the Four Categories of the BCG Matrix?
The BCG matrix classifies products into four categories based on two key criteria: relative market share and market growth rate. These dimensions help businesses understand competitive strength and market attractiveness.
Stars
Stars are products with high market share in high-growth markets. They generate strong revenue and profit while requiring continuous investment to maintain their leadership position.
These products represent the company’s future cash generators. Strategic communication and PR distribution can reinforce their market leadership by increasing global media reach and strengthening brand perception.
Cash Cows
Cash cows have high market share in low-growth or mature markets. They hold a stable and dominant position, generating consistent and predictable cash flow.
Because they require relatively low investment, the profits generated by cash cows can be used to fund other products in the portfolio, particularly stars and promising question marks.
Question Marks
Question marks operate in high-growth markets but have low market share. They offer significant potential but involve considerable uncertainty and risk.
These products require substantial investment to gain market share and compete with established leaders. Strategic PR efforts and targeted visibility can accelerate awareness and support their transition into star products, though success is never guaranteed.
Dogs
Dogs have low market share in low-growth or declining markets. They typically generate limited profit and may consume more resources than they justify.
In many cases, companies choose to divest or discontinue these products. However, with effective repositioning and communication strategies, some may find a renewed niche or extended lifecycle.
How to Plot a Product on the BCG Matrix?
Plotting products on the BCG matrix (Boston matrix) requires a structured evaluation of your portfolio based on market share and market growth rate. The goal is to position each product clearly within one of the four quadrants.
1. Identify the Products or Business Units
Start by defining what you want to analyze. This could include specific products, service lines, business units, geographic regions, or customer segments. The key is to select comparable units that operate within clearly defined markets.
2. Collect Market Share and Growth Data
Gather reliable data on relative market share and market growth rate for each product or unit. Useful sources include sales reports, industry analyses, customer research, and competitor benchmarking. Comparing your performance to market averages helps ensure accurate positioning.
3. Position Products on the Four-Quadrant Matrix
Use market share as the horizontal axis and growth rate as the vertical axis. Each product is placed in one of four quadrants: Stars, Cash Cows, Question Marks, or Dogs.
To enhance clarity, companies often represent products with circles sized according to revenue or profit contribution. When a product moves into a higher-growth or higher-share category, it signals strategic progress. This transition can also serve as a strong communication opportunity supported by professional PR efforts.
How to Use the BCG Matrix?
The BCG matrix supports strategic decision-making by helping companies determine which products to invest in, maintain, harvest, or divest. Resource allocation becomes more systematic when guided by portfolio position and long-term potential.
Strategic decisions also require effective communication. When companies shift priorities or increase investments in certain product lines, PR plays a critical role in conveying these changes clearly and strategically to stakeholders and the market.
When companies prioritize star and high-potential products, visibility becomes a strategic lever alongside financial investment. At this stage, professional press release distribution helps communicate growth signals, leadership positioning, and market expansion plans to relevant audiences.
Stars
Invest heavily in stars to sustain or increase market share and maintain growth momentum. These products represent the company’s strongest competitive assets and require continuous attention.
Common strategies include product innovation, marketing differentiation, expanded distribution, and pricing optimization. Supporting stars effectively is often referred to as the BCG matrix star strategy.
Supporting star products often requires targeted communication aligned with expansion goals. Well-structured press release distribution packages can help brands reinforce leadership perception across priority markets.
Cash Cows
Maintain cash cows to maximize profitability and generate steady cash flow. These products operate in mature markets and require limited additional investment.
Strategies may include cost control, operational efficiency, customer loyalty programs, and incremental quality improvements. The cash generated here often funds investments in stars and selected question marks.
Question Marks
Carefully evaluate whether to invest further in question marks. These products operate in high-growth markets but lack strong market share, making them both opportunities and risks.
Decision criteria may include market attractiveness, competitive advantage, strategic alignment, and expected financial return. If supported effectively, question marks can evolve into stars; if not, they may need to be discontinued.
Dogs
Divest or discontinue dogs to release resources for more promising products. These units operate in low-growth markets with limited competitive strength.
Options include selling, licensing, restructuring, or shutting down operations. Strategic exit decisions allow companies to maintain focus on higher-value opportunities within the portfolio.
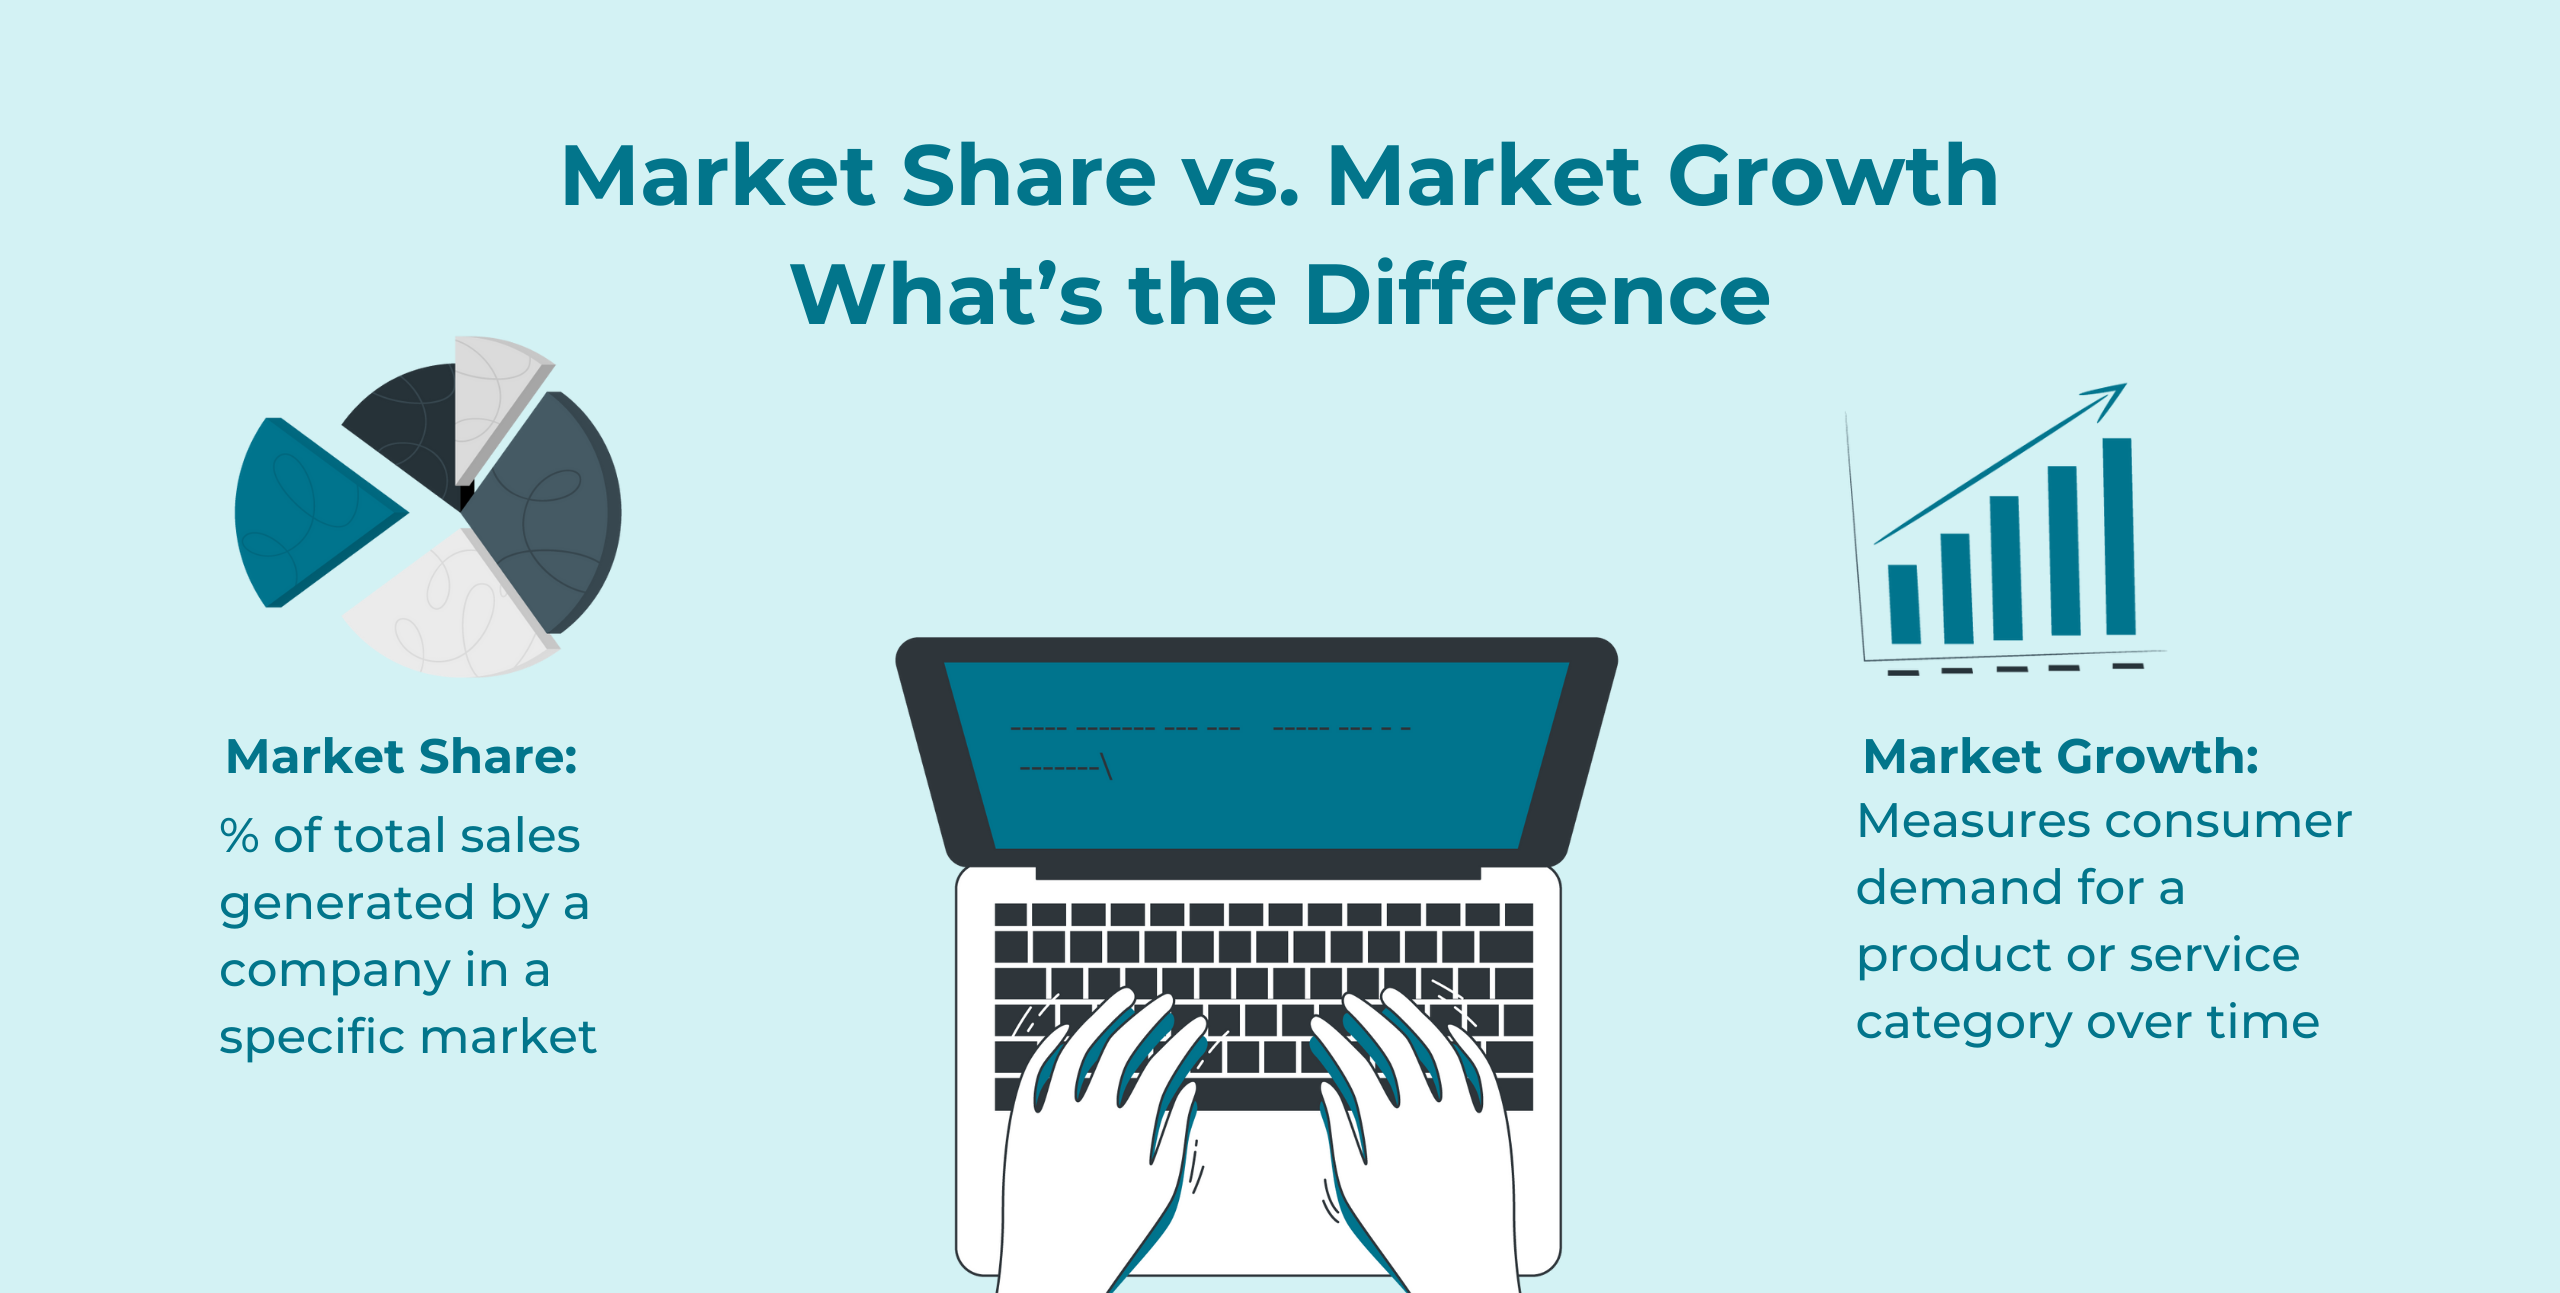
How Are Market Share and Growth Rate Calculated?
Market share and growth rate are two core performance indicators used to evaluate a product’s competitive strength and market potential. These metrics are essential when positioning products within the BCG matrix.
Market Share Calculation
Market share represents the percentage of total industry sales generated by your business within a specific period.
To calculate market share, divide your company’s total sales by total industry sales for the same period and multiply by 100.
Market share = (Your sales / Total industry sales) x 100
For example, if your company generated $10,000 in sales in one month and total market sales were $100,000, your market share would be 10%. This means your company captured 10% of the market during that period.
Growth Rate Calculation
Growth rate measures the percentage increase or decrease in a variable over a specific time period, such as monthly, quarterly, or annually.
To calculate growth rate, subtract the starting value from the ending value, divide by the starting value, and multiply by 100.
Growth rate = ((Ending value − Starting value) / Starting value) x 100
For example, if sales increased from $5,000 in January to $6,000 in February, the monthly growth rate would be 20%. This indicates a 20% increase over one month.
Compound Annual Growth Rate (CAGR)
For multi-year analysis, companies often use Compound Annual Growth Rate (CAGR). This formula accounts for compounding growth over multiple periods.
CAGR = ((Ending value / Starting value) ^ (1 / Number of periods)) − 1
For instance, if sales increased from $5,000 in January 2022 to $7,500 in January 2023, the annual growth rate would be 50%. CAGR provides a clearer long-term performance view compared to simple percentage change.
How Is the BCG Matrix Reviewed and Updated?
The BCG matrix should be reviewed regularly to reflect changes in market conditions, competitive dynamics, and product performance. Since both market share and growth rate fluctuate over time, portfolio positioning must remain dynamic.
Ongoing evaluation ensures that strategic planning and resource allocation remain aligned with business objectives.
Monitoring Performance Changes
Assess how the market share and growth rate of each product have evolved since the last evaluation. Identify the underlying causes, such as competitive actions, pricing adjustments, innovation, or shifts in consumer demand.
Evaluating Strategy Effectiveness
Review whether investment decisions and strategic initiatives are delivering expected results. Determine which actions have strengthened performance and which require adjustment.
Analyzing Market and Competitive Shifts
Examine how the overall market environment has changed. New entrants, regulatory changes, technological innovation, or economic shifts can significantly affect portfolio positioning.
Reassessing Business Priorities
Consider whether company objectives have evolved. Growth ambitions, profitability targets, or expansion plans may alter how products should be positioned within the matrix.
Regular updates ensure that the BCG matrix remains a practical and forward-looking strategic tool rather than a static analytical model.
Real-World BCG Matrix Examples from Popular Brands: Coca-Cola and Apple
To better understand how the BCG matrix works in practice, it is useful to examine how global brands position their products within the four categories: Stars, Cash Cows, Question Marks, and Dogs.
Example 1: Coca-Cola
Coca-Cola is one of the world’s leading ready-to-drink beverage companies, managing a portfolio of more than 500 brands across multiple markets. While it offers a wide range of products, certain brands clearly stand out in terms of growth and market share.
Stars
Coke Zero is considered a star product, combining high market share with strong growth. Positioned as a sugar-free alternative to classic cola, it appeals to health-conscious consumers while maintaining the original taste experience. Continuous marketing and distribution investment support its leadership position.
Sprite is another star product. As a globally recognized lemon-lime soft drink with strong demand and growth momentum, it requires ongoing investment to maintain brand visibility and competitive strength.
Cash Cows
Diet Coke represents a classic cash cow. Although operating in a mature, lower-growth segment, it maintains a strong market share and loyal customer base. Its stable revenue stream helps finance investment in higher-growth products.
Question Marks
Fanta can be categorized as a question mark in certain markets. While it shows strong growth potential, its market share varies by region and faces competition from alternative soft drink brands. Strategic investment and positioning efforts are required for Fanta to strengthen its competitive standing.
Dogs
Tab, once an innovative diet soda, eventually moved into the dog category. With low market share and limited growth, it generated minimal revenue compared to other products in the portfolio. Such products are often phased out or repositioned.
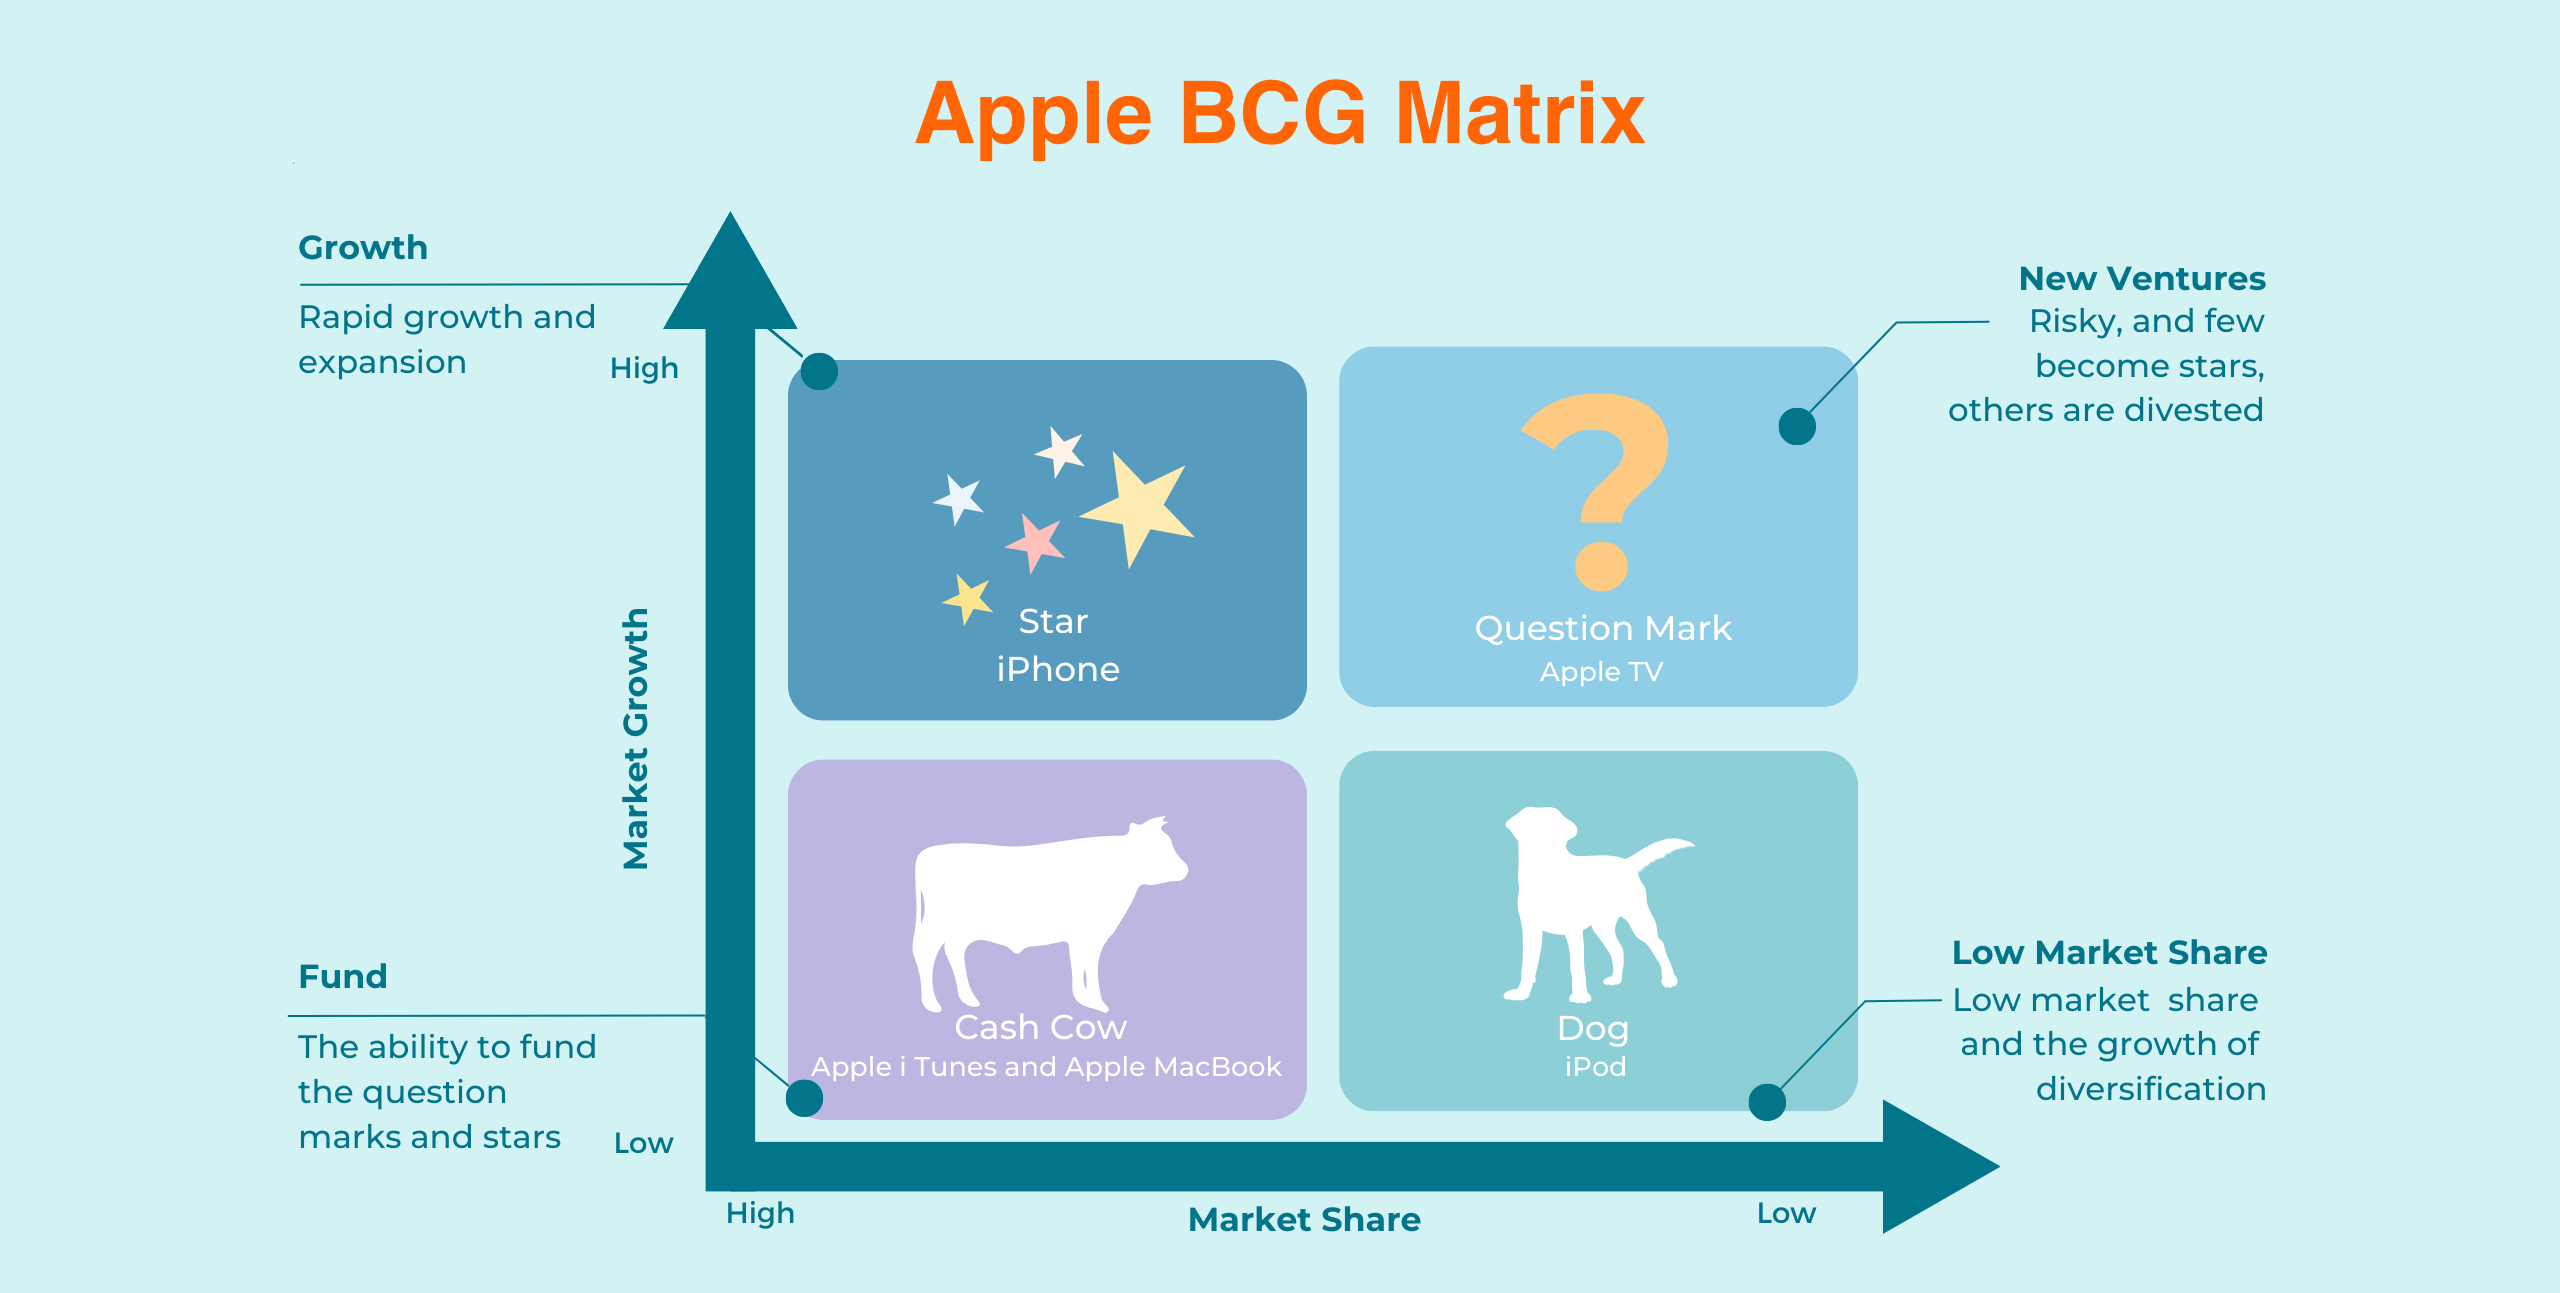
Example 2: Apple
Apple is a global technology company known for designing consumer electronics, software, and digital services. Its diversified product portfolio makes it a strong example of BCG matrix application.
Stars
The iPhone is Apple’s most prominent star product. With high market share and continued global demand, it generates a significant portion of the company’s revenue. Continuous innovation, ecosystem development, and marketing investment sustain its leadership.
The iPad also functions as a star in the tablet market. It maintains strong market presence and ongoing growth, supported by product upgrades and expanded use cases in education, business, and creative industries.
Cash Cows
The Mac line represents a cash cow. While growth may be slower compared to newer product categories, it holds a solid market share and a loyal customer base. Stable profitability allows Apple to reinvest in emerging technologies and services.
Question Marks
Apple TV, as a streaming device and service platform, can be viewed as a question mark. It operates in a competitive and rapidly growing market. Although it presents strong potential, further investment is required to increase market share and secure long-term positioning.
Dogs
The iPod, once revolutionary, gradually moved into the dog category as smartphones replaced standalone music players. With declining demand and limited revenue contribution, it became less strategically significant within Apple’s portfolio.
Strategic Insights from BCG Examples
These real-world examples demonstrate how the BCG matrix helps companies evaluate product portfolios and make structured decisions about investment, maintenance, or divestment.
Beyond internal strategy, communicating portfolio shifts and growth milestones effectively strengthens brand perception. A well-structured PR strategy and consistent press release distribution can ensure that strategic moves are clearly understood by stakeholders and the public.
When integrated with digital communication tools, the BCG matrix evolves from a purely analytical model into a framework that also supports external brand positioning and long-term visibility.
If your product moves into a higher-growth category, sharing that milestone strategically can accelerate market momentum. You can submit press release to amplify important portfolio developments and strengthen brand positioning.
Frequently Asked Questions About the BCG Matrix
What is the main purpose of the BCG matrix?
The main purpose of the BCG matrix is to help companies evaluate their product portfolio based on market growth and relative market share. It supports strategic decisions about where to invest, maintain, harvest, or divest resources.
What are the four categories of the BCG matrix?
The four categories are Stars, Cash Cows, Question Marks, and Dogs. Each category represents a different combination of market growth rate and market share, guiding investment and resource allocation decisions.
How does the BCG matrix help with strategic planning?
The BCG matrix provides a structured framework for comparing products within a portfolio. By identifying high-growth opportunities and underperforming units, companies can prioritize investments and optimize long-term profitability.
Is the BCG matrix still relevant today?
Yes, the BCG matrix remains relevant as a portfolio analysis tool. Although markets have become more dynamic, the framework still helps businesses understand competitive positioning and growth potential when combined with additional strategic analysis.
How often should a company update its BCG matrix?
Companies should review and update their BCG matrix regularly, especially when market conditions, competitive dynamics, or internal business goals change. Quarterly or annual reviews are common in strategic planning processes.
What are the limitations of the BCG matrix?
The BCG matrix simplifies complex market dynamics into two variables: growth rate and market share. It does not account for factors such as market profitability, brand strength, innovation capability, or external risks. Therefore, it should be used alongside other strategic tools.